The numbers you actually run on.
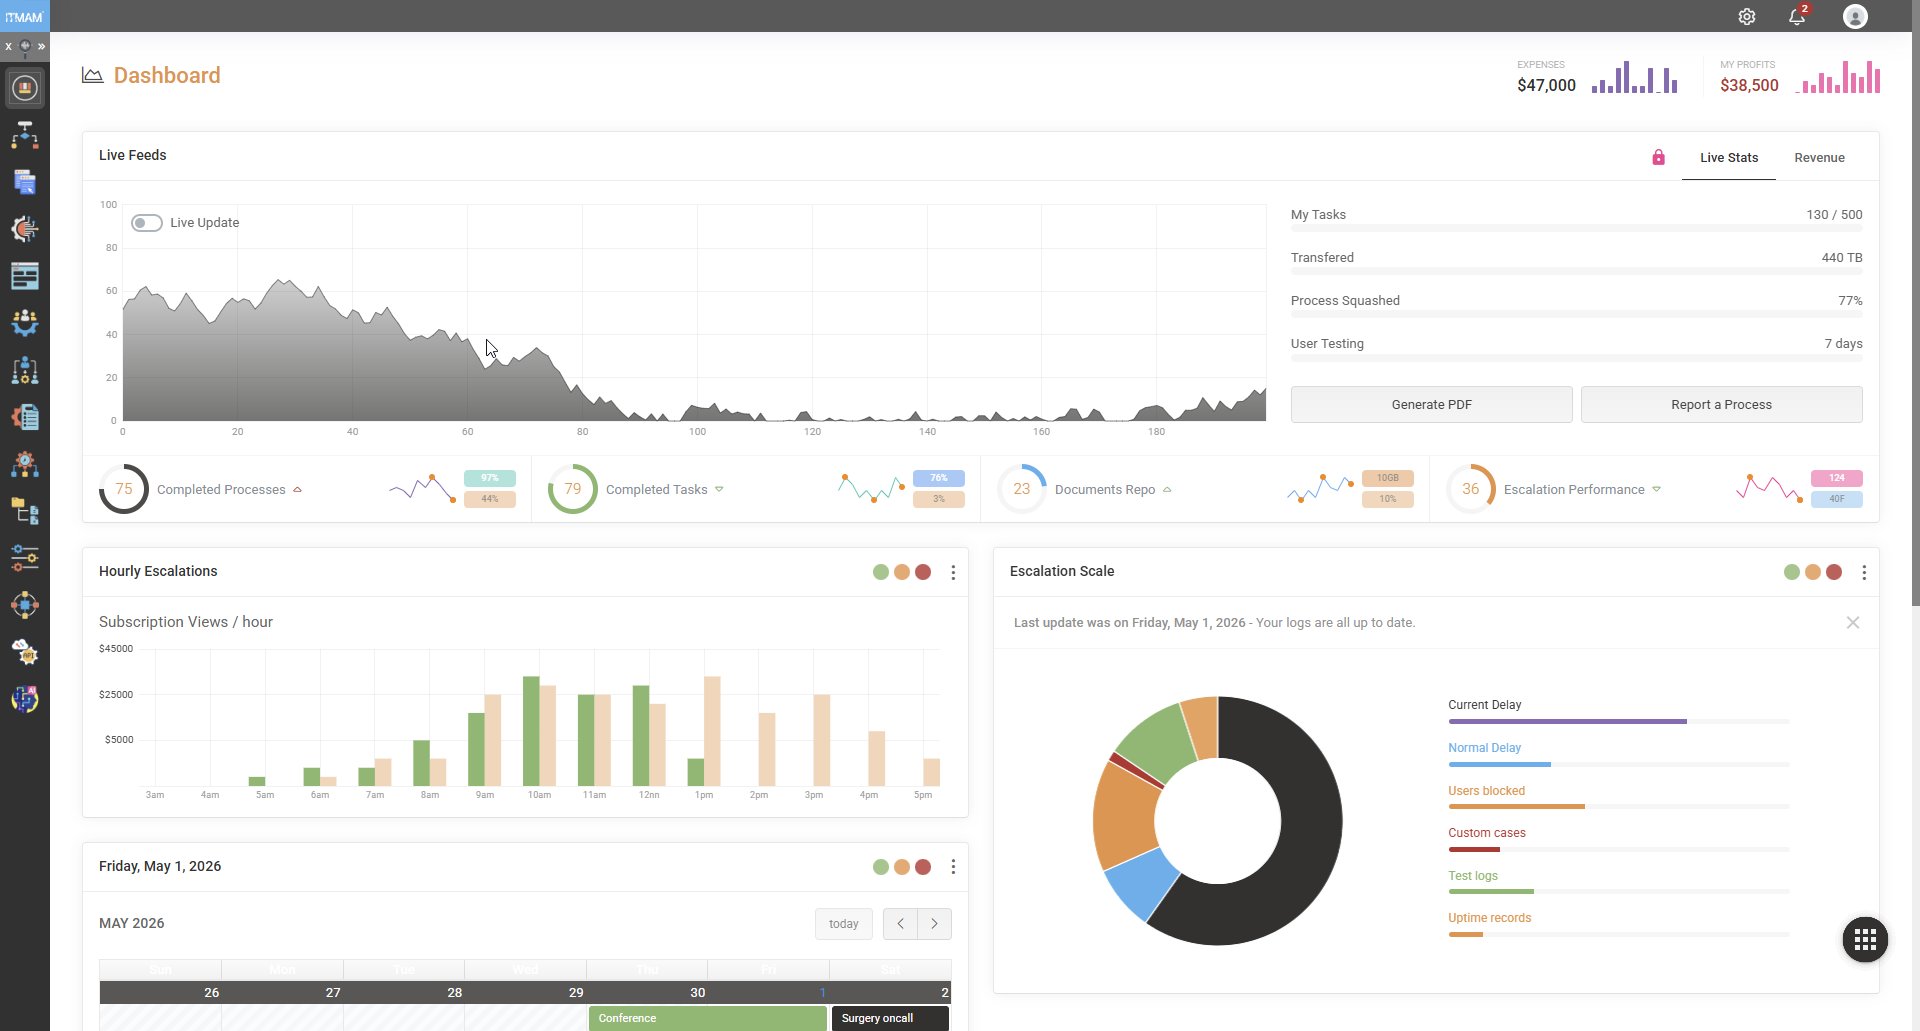
Every operational team gets a live dashboard tuned to their work — not a stitched-together report compiled from yesterday's spreadsheet exports. Throughput per workflow, average cycle time, instances breaching SLA, queue depth by team, exception rate by category — all refreshed against the running engine, not a snapshot.
Dashboards are role-bound. The CFO sees aggregate financial-impact metrics. The operations director sees throughput and bottlenecks. The team lead sees their own queue. No single dashboard tries to be all of them.
Deadlines, with teeth.
Every user task can carry an SLA. The engine tracks the clock against every running instance and surfaces what's at risk — before the breach, not after. Auto-escalation rules can re-route work, notify a supervisor, change priority, or trigger a compensation flow when the deadline approaches.
SLA breach reports are not after-the-fact apologies. They are diagnostic instruments — the engine knows exactly which step held up the chain and how long it sat.
The first time we saw the SLA dashboard, we discovered a queue that had been silently growing for nine months.
Every action. Immutably recorded.
For each instance, the audit log captures: every user action with timestamp and authenticated identity; every service call with request, response (redacted by policy) and duration; every rule evaluation with inputs, outputs and the exact rule version applied; every state transition; and every change to the underlying process definition that was active for this instance.
The log is append-only. Nothing can edit it after the fact — not even a platform administrator. For regulated environments, this is the single artifact auditors come to inspect, and it answers every question they ask.
Open any case. See exactly what happened.
Click any historical instance — even one from two years ago — and you get a visual replay: which path the token followed through the diagram, which gateway branches fired, which rules evaluated to what, who acted on each user task, what the service responses looked like, and where time was spent. The exact version of the model and the rules that were active is rendered alongside.
This is the artifact that converts a complaint into a closed case. “Why was my application rejected?” has a one-screen answer.
Plug into the rest of your stack.
Dashboards are great. The numbers also need to live in your data warehouse, your BI tool, and your regulatory submissions. IJRA@ exports to:
- Data warehouses — incremental change feeds to Snowflake, BigQuery, Redshift.
- BI tools — direct connection from Power BI, Tableau, Looker.
- Compliance submissions — scheduled reports in regulator-specified formats.
- Webhook streams — real-time event feeds to downstream listeners.